❗Disclaimer: All opinions are my own.
Context
By benchmark I don’t mean the performance regression test suite for your own application, which if you do have, I’m your fan!
Nor do I mean metrics benchmarks (like in ML) to assess model performance (e.g. F1-score) irrespective of hardware choice. The latter, whilst it has its own issues (benchmark versus real-world product performance), it’s not a computational problem.
Instead, what if my question is: will software X perform better on hardware A or hardware B?
Looking at public benchmarks, I can try to guess, but should I even look at them? This post explores if it’s useful for developers to consider synthetic benchmarks.
Overview
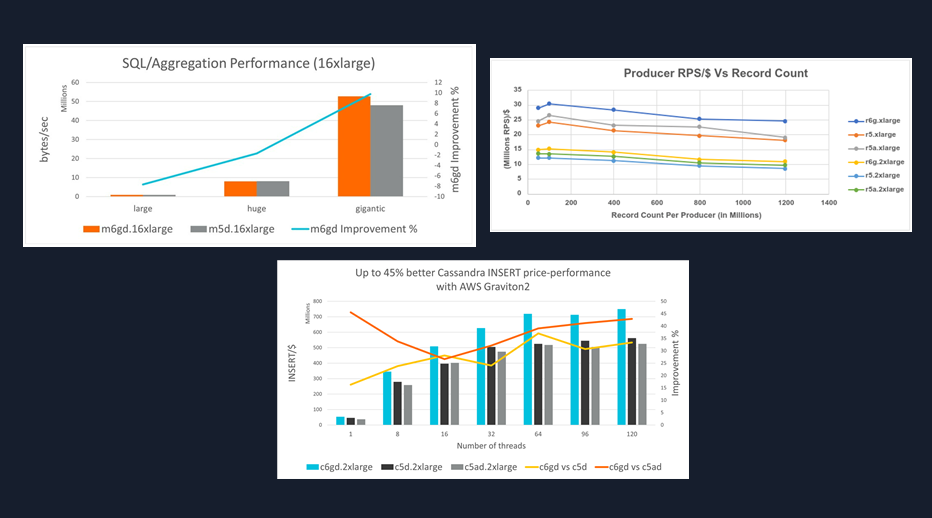
The tech industry has a long-standing practice of running benchmarks whenever a new hardware product gets released. See SPEC CPU or for AWS Graviton, various Arm Community blog posts showing results like these:
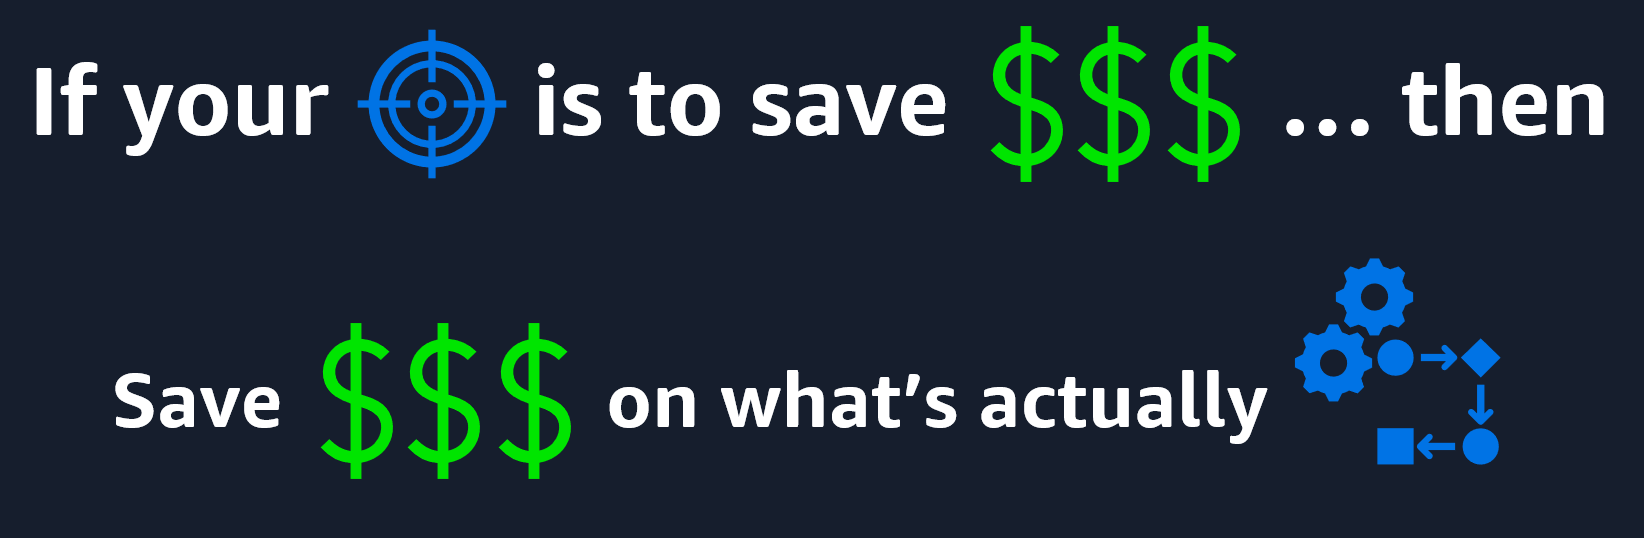
Some people love benchmarks as they make things seem easy and after all.. isn’t it nice when we can over-simplify for the sake of decision-making?
And benchmarks can help in some ways, such as setting goals for the industry to surpass, or give ideas on what to try next. But the practicalities of running most software in production and under production-like conditions typically renders such benchmarks ineffective.
“What I cannot create, I do not understand”
I often get asked questions like:
- “Will software X perform better on hardware A?”
- “Will I save anything on hardware A? I am running software X, Y, and Z”
- “This online article says hardware A will save me a lot of money on software X” (sensational, but ugh..)
There’s no sensible way I can answer these questions with any reasonable precision, yet the answer of “I don’t know” isn’t to most people’s liking.
Asking “why don’t you test so you can get your answer?”, is even less to people’s liking.
Hold on! I’m not the..
From the perspective of a solutions architect that advises customers on tech matters, what I’m not is:
- the hardware creator (this matters less, and hardware isn’t really a black box - except for when docs like PMU counters lack detail.. those who know, know)
- the software creator (the questions often refer to a customer’s software or 3rd parties)
- the data creator (I don’t see the data that the software in question runs, it tends to be confidential)
So more often than not, I don’t have access to the proprietary software and data.
So, why can’t I just make an educated guess?
I could (inc. based on previous experience), but what are the chances such guesses (similar to synthetic benchmarks shown at the beginning) will be close to reality?
Let’s rewind
What does it mean to save money by running software X on hardware A?
To simplify*, it means that software X runs faster on hardware A or hardware A is cheaper (and software X runs just as fast or faster).
*-there are other factors that matter too (such as how stable is hardware A under high utilization, affecting scaling decisions and leading to less/more machines)
What choices determine the performance of software X on hardware A?
Not an exclusive list, but also think of factors like:
- Virtualization overhead
- Operating system kernel
- Coding stack (e.g. compiler, interpreter, JVM)
- Compilation and runtime flags
- 3rd-party libraries
- Software versions
- Input data
The software development teams working on a product combining all these technologies will fine-tune this stack and configuration across time.
What are the chances of a benchmark matching this permutation of custom code and usage of specific technologies?
If our goal is to save costs when running software X on hardware A, we need to assess (not guess) the changes we make to our stack, be it software or hardware.
Demonstration
Let’s imagine I own a software application that I turned into a commercial product. Most modern apps like this one will be made of proprietary code and a bunch of packages from 3rd parties (e.g. huggingface, pytorch, numpy).
Typically, these packages will have some benchmarks published somewhere.
Q: Alright, but.. what matters to me? (as a fictitious business owner)
A: Likely many things, but an important one is the bill to run this product.
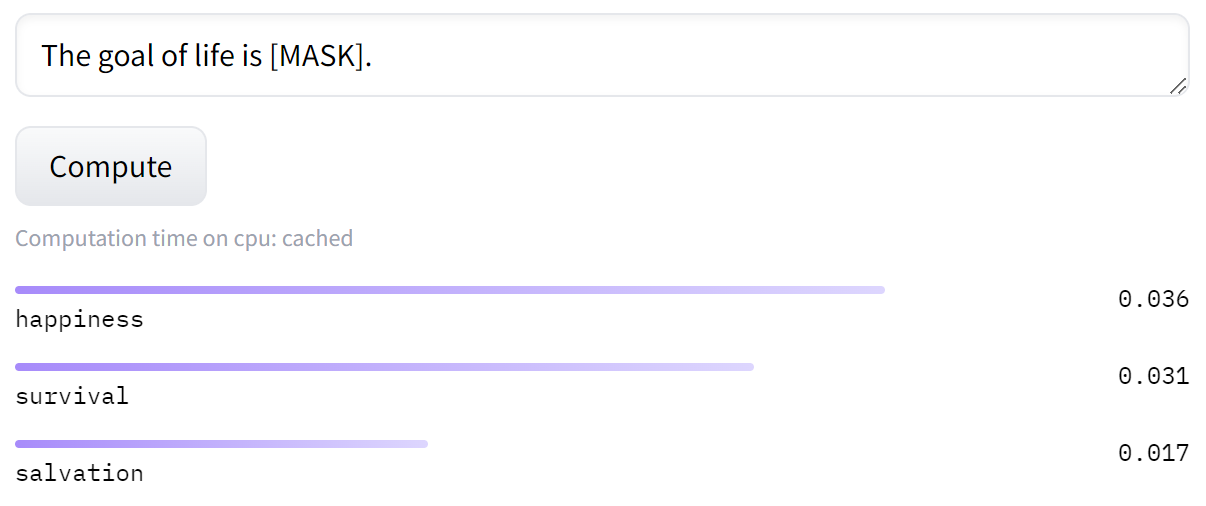
To keep it simple, let’s assume this product is a chatbot which answers user requests by providing 1-word answers (see below example with a HuggingFace DistilBERT model).
Disclaimer: LLMs can run on CPUs, but in production workloads, their size and response times mean you’ll likely need to use a GPU/TPU. I’m using a CPU here because it’s easier to understand.
“Attention Is All You Need”
The basis of most large language models (LLMs), including DistilBERT, is the transformer architecture introduced in 2017.
Considerations on using popular (high-level) machine learning tooling:
- We have less control over changing data types, operators, kernels, etc.
- They apply many hidden optimizations, including at runtime
- In general, we trust them to pick the best optimizations for us
Which is great in most cases!
But for the purpose of this demonstration, I need finer control to explain how changes in software and data affect hardware utilization.
This is not a post on how LLMs work, so for the explanation on the ML side, please refer to materials on the subject.
We observe that the main part of a Transformer is the Multi-Head Attention Block.
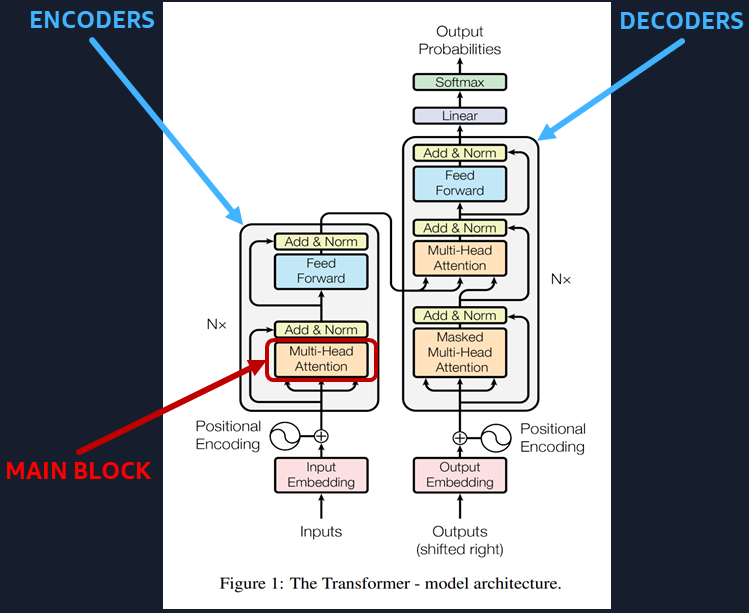
Fun Fact: LLMs (like ChatGPT) need to compute a large number of matrix arithmetic operations to give you a result.
Multi-Head Attention Block
In a nutshell:
- A Multi-Head Attention Block is composed of several Self-Attention Layers (number of heads)
- The input goes through each Self-Attention Layer and produces an output
- Concatenating all the outputs of the Self-Attention Layers leads to an output of same size as input
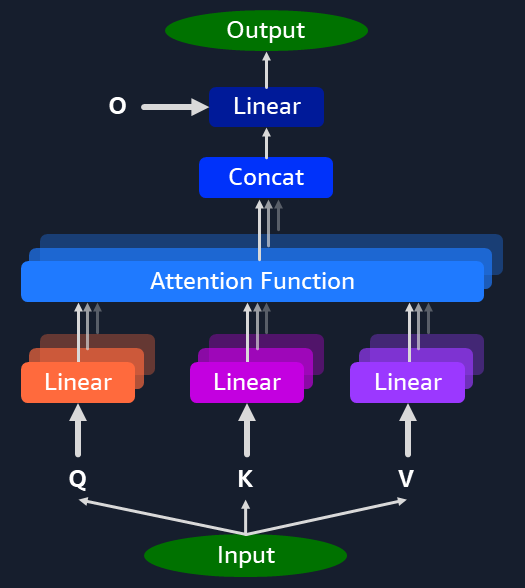
From a computational perspective we have:
- Input and output matrices
- Weight and bias matrices (Q, K, V, O)
- Linear layers doing matrix multiplication and addition
- Supporting layers for matrix transpose, concatenation and softmax
Conceptually, an example pass through the multi-head attention block computation looks like this:
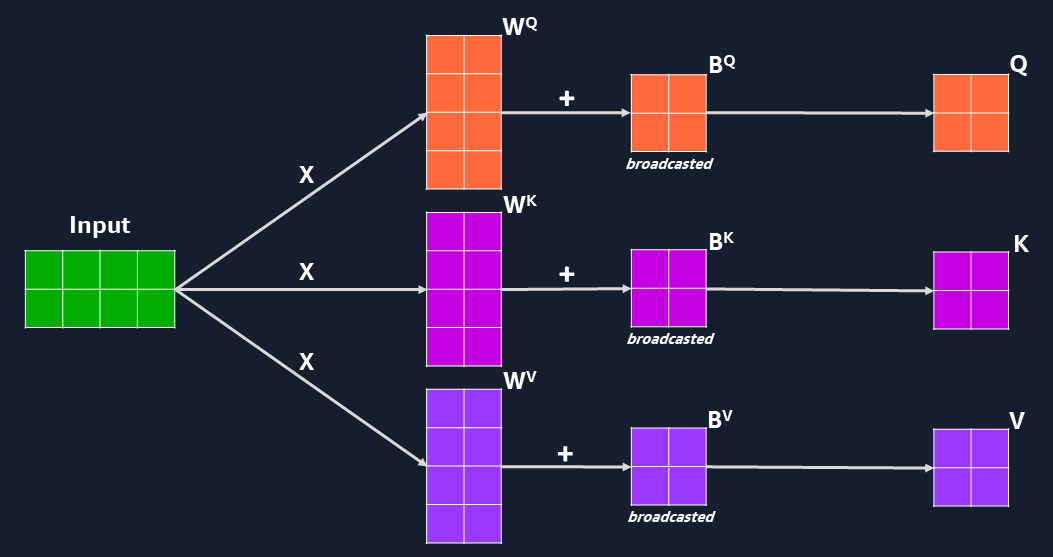
- Use 3 linear layers on input to obtain matrices Q, K, and V
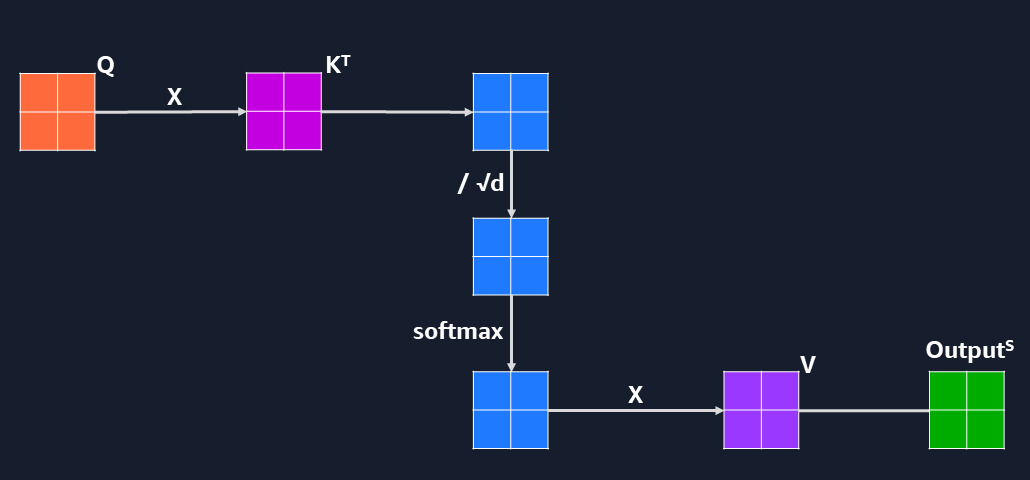
- Apply the self-attention formula to obtain the output for one self-attention layer
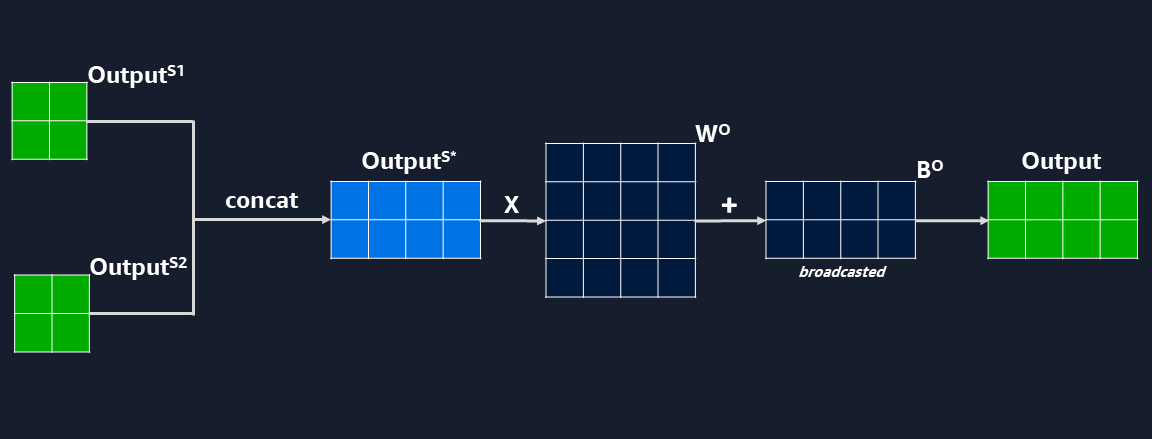
- Concatenate the outputs of each self-attention layer and apply another linear layer to get result
Implementation
To make it easier to visualize the execution as I make changes to the code, I will use a CPU to run this Multi-Head Attention Block.
Picked AWS Graviton (arm64 CPU architecture) as a high-performing cost-effective choice on the AWS cloud.
Arm Compute Library
For performance reasons, the default backend for the AWS Graviton CPU in popular frameworks like PyTorch and TensorFlow is oneDNN+ACL. The operators and kernels (essentially, the compute part) come from the ACL library.
Let’s implement the Multi-Head Attention Block based on the steps above using C++ and ACL.
For example, matrix multiplication and addition can be implemented with NGEMM.
Enough ML, Let’s Compute!
A note on ML implementation efficiency:
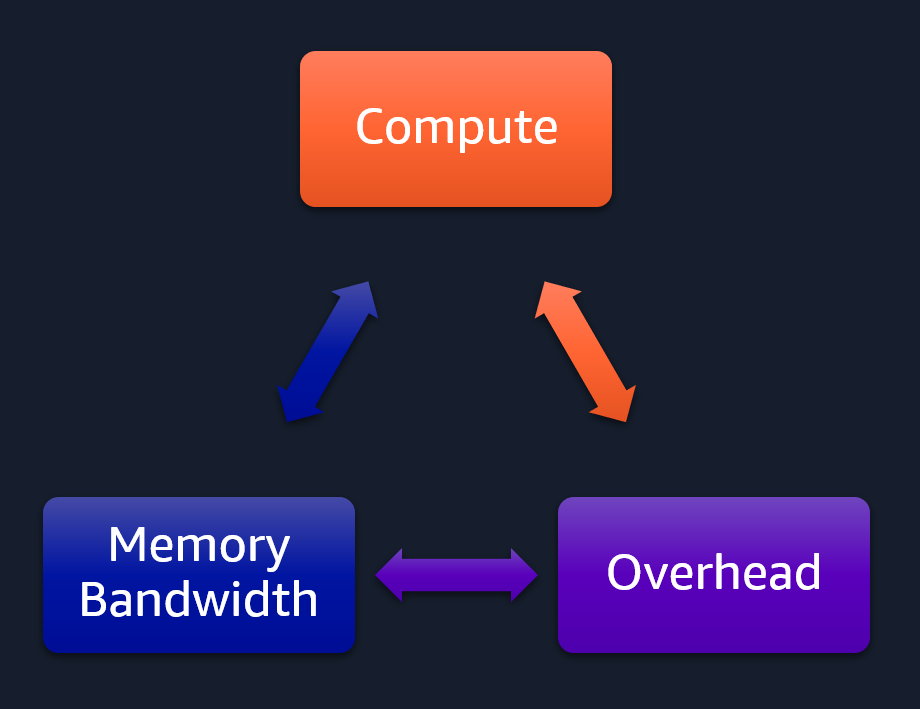
A compute-bound program will efficiently (>80%) utilize all compute units doing operations such as matrix multiplication.
Depending on the architecture of the model and as the data or layers become bigger, we will become limited by the available memory bandwidth, slowing us down.
If, however, the model has no intensive computation to perform and perhaps uses small data sizes, then it is more likely a large portion of the program run will be spent on framework or OS kernel related overhead.
I used a .metal EC2 instance to get more reliable PMU hardware counters and avoid issues incurred by using shared environments in Amazon EC2 (e.g. hypervisor behaviour to distribute resources).
I opted for a Graviton 3 instance that has more compute cores (c7g) and supports SVE vectorized instructions that will accelerate matrix operations. To reduce likelihood for slowdowns from OS kernel implementation, I chose Ubuntu 22.04 with a more recent Linux kernel version: 6.5.
Except ACL kernels that will do the matrix operations and are already parallelized (per kernel), I wrote the rest of the multi-attention head implementation to execute sequentially. Whilst inefficient (as self-attention layers can be parallelized), it makes it easier to demonstrate how we change the bottleneck in our program between the 3 aspects depicted in the image above.
Analysis
We start with the config from the HuggingFace DistilBERT model that has an input size of 12x768 and with layers that go up to 768x768.
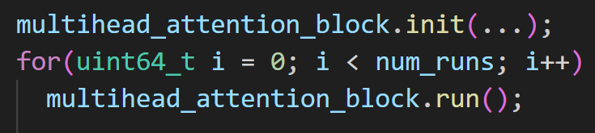
We run the multi-head attention block an adjustable large number of times and focus on the .run() part, not the overhead from initialization (.init()). The output from block_(i) is the input for block_(i+1).
The data type used for the matrix elements is FP32.
Initial Insights
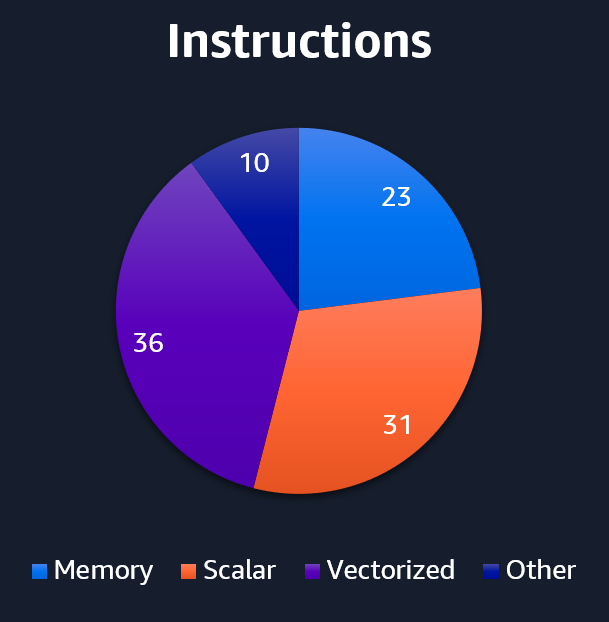
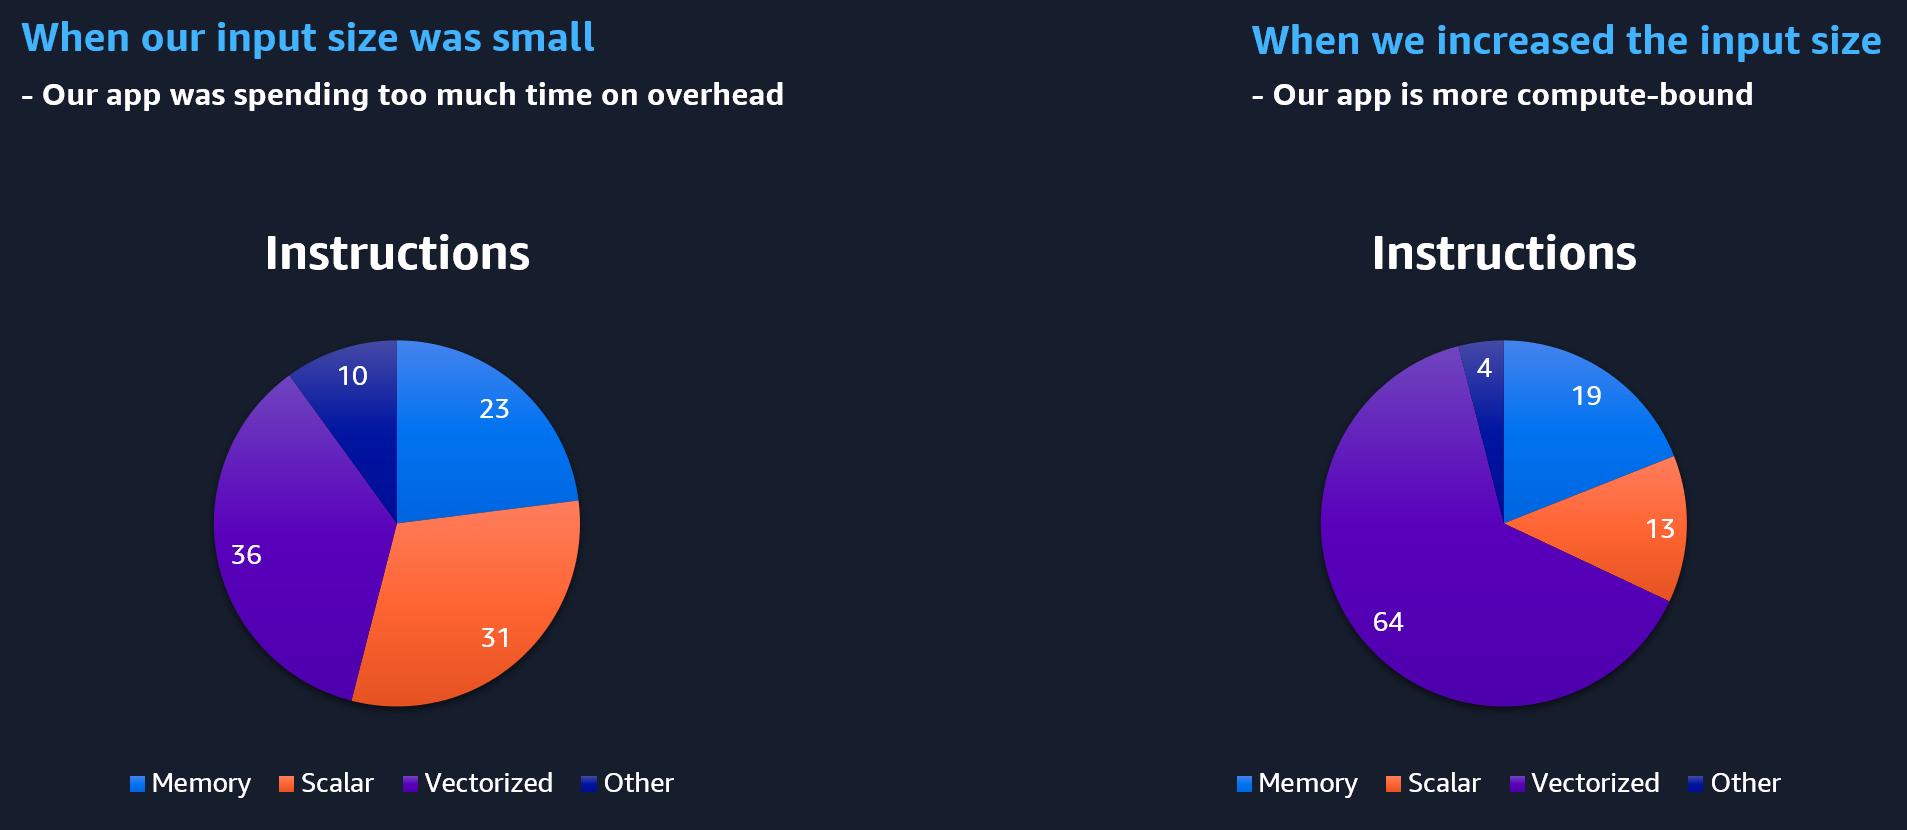
The instructions mix in this program has a large number of vectorized instructions as expected. However, there’s a lot of scalar ops (mostly integer) that don’t make as much sense since all compute kernels use either SVE or NEON vectorized code. In total, 42% of instructions are SVE related (compute and load/stores) distributed between the purple and blue slices.
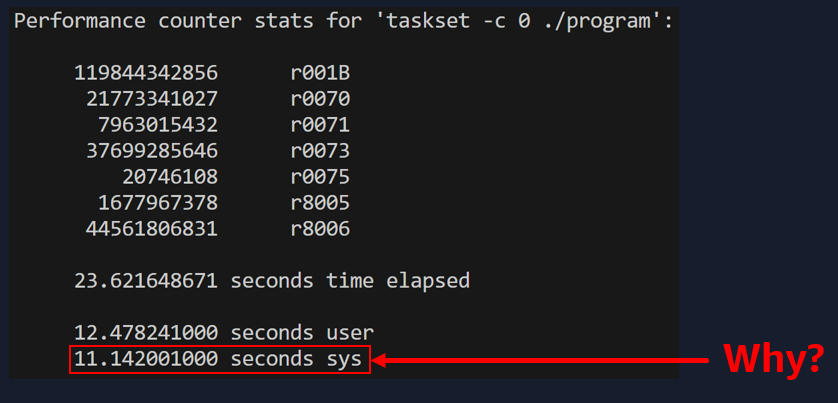
Fun Fact: modern hardware executes your code speculatively. That means it executes more code than you think your software should run. The PMU counters on Arm Neoverse are limited and can only count all instructions (inc. speculative ones), not just those committed (also known as, retired).
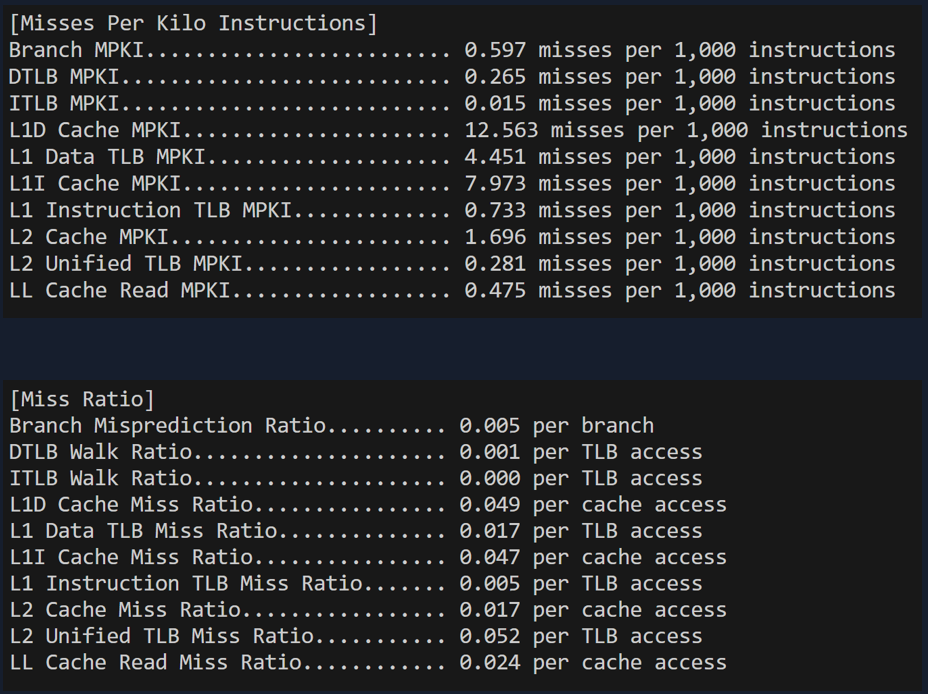
Looking at the performance analysis of some counters (the event codes, e.g. r001B, correspond to hardware-specific counters - see Arm Neoverse V1 PMU Guide for descriptions), we notice a ratio between user/sys runtime that is not quite right either. This ratio remains the same no matter how many times we run our blocks.
Fun Fact: The Linux perf tool here multiplexes the PMU counters as we are counting more than 6 general-purpose events (needed to determine the instruction mix). This reduces the accuracy of the numbers we see, as we don’t get all the samples the hardware produced. Treat these numbers as approximations.
In this current configuration, branch mispredictions (causing more unnecessary code to be executed) or cache misses (leading to RAM usage that would slow us down), have negligible impact on performance.
So, with the data sizes we’re using for our matrices and the number of runs, what do we think is happening? Well, we need to see what’s running.
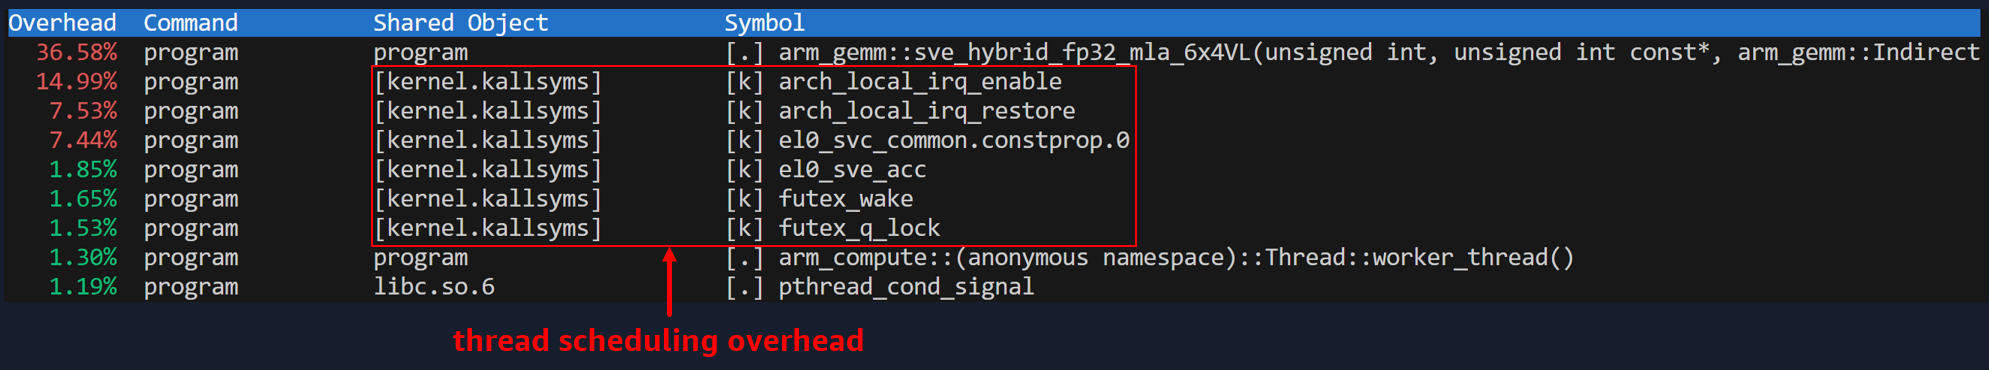
We are spending a lot of time processing thread interrupts. Where do these threads come from? ACL parallelizes compute kernel execution on multiple CPU cores by leveraging a multi-threaded implementation. So, it appears we are spending more time scheduling and changing between threads, than actually computing operations.
Going from Overhead to Compute-bound
What’s the ‘intuition’ to change the data sizes to something bigger?
- Many (relatively small) compute kernels are run by a pool of threads (ACL’s default CPUScheduler uses as many threads as CPU cores available, in this case 64)
- Kernels, layers, and blocks are executed sequentially, so we finish fast given the amount of CPU cores we have and move on to the other piece of work
So, if we increase our matrix data sizes, we expect to do more computations. There’s also more time spent in .init() to allocate the memory for these larger matrices. That means we need to offset .init() by running sufficient blocks to minimise how much execution time is spent in .init(). We do this through experimentation.
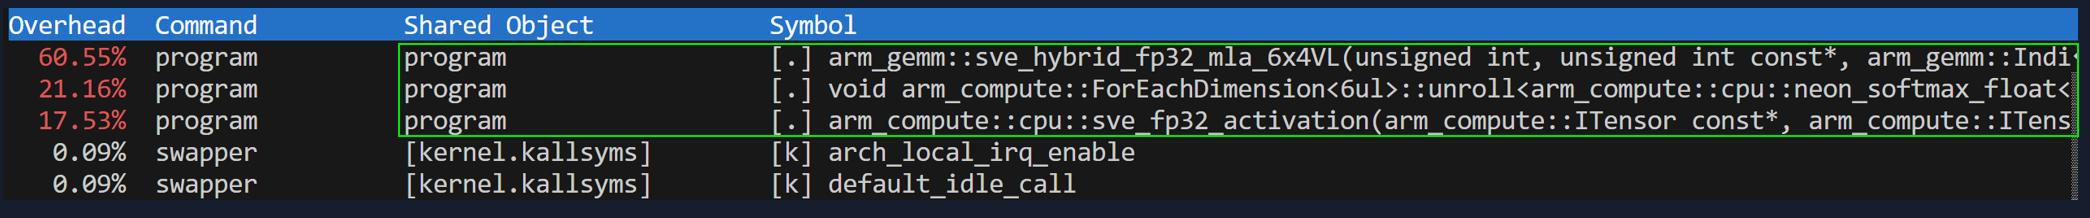
As we see below, we are now compute-bound, with the majority of the time spent on computing linear layers. That doesn’t make our program any more correct than the previous version, but it shows that changes to input sizes or network model architecture, can balance your software from ML framework overhead to utilizing the CPU more.
Let’s see what happened to the instruction mix. We have more vectorized ones, and less scalar ones (overhead).
Side effect on data precision
LLMs can use data types with 4-byte precision like FP32, or less (FP16, BFloat16, Int8, etc.), up to more recently a new data type that uses just [-1,0,-1] (amazing, isn’t it!). Using a reduced precision data type means you compute faster and use less memory, enhancing your computational performance and reducing your costs.
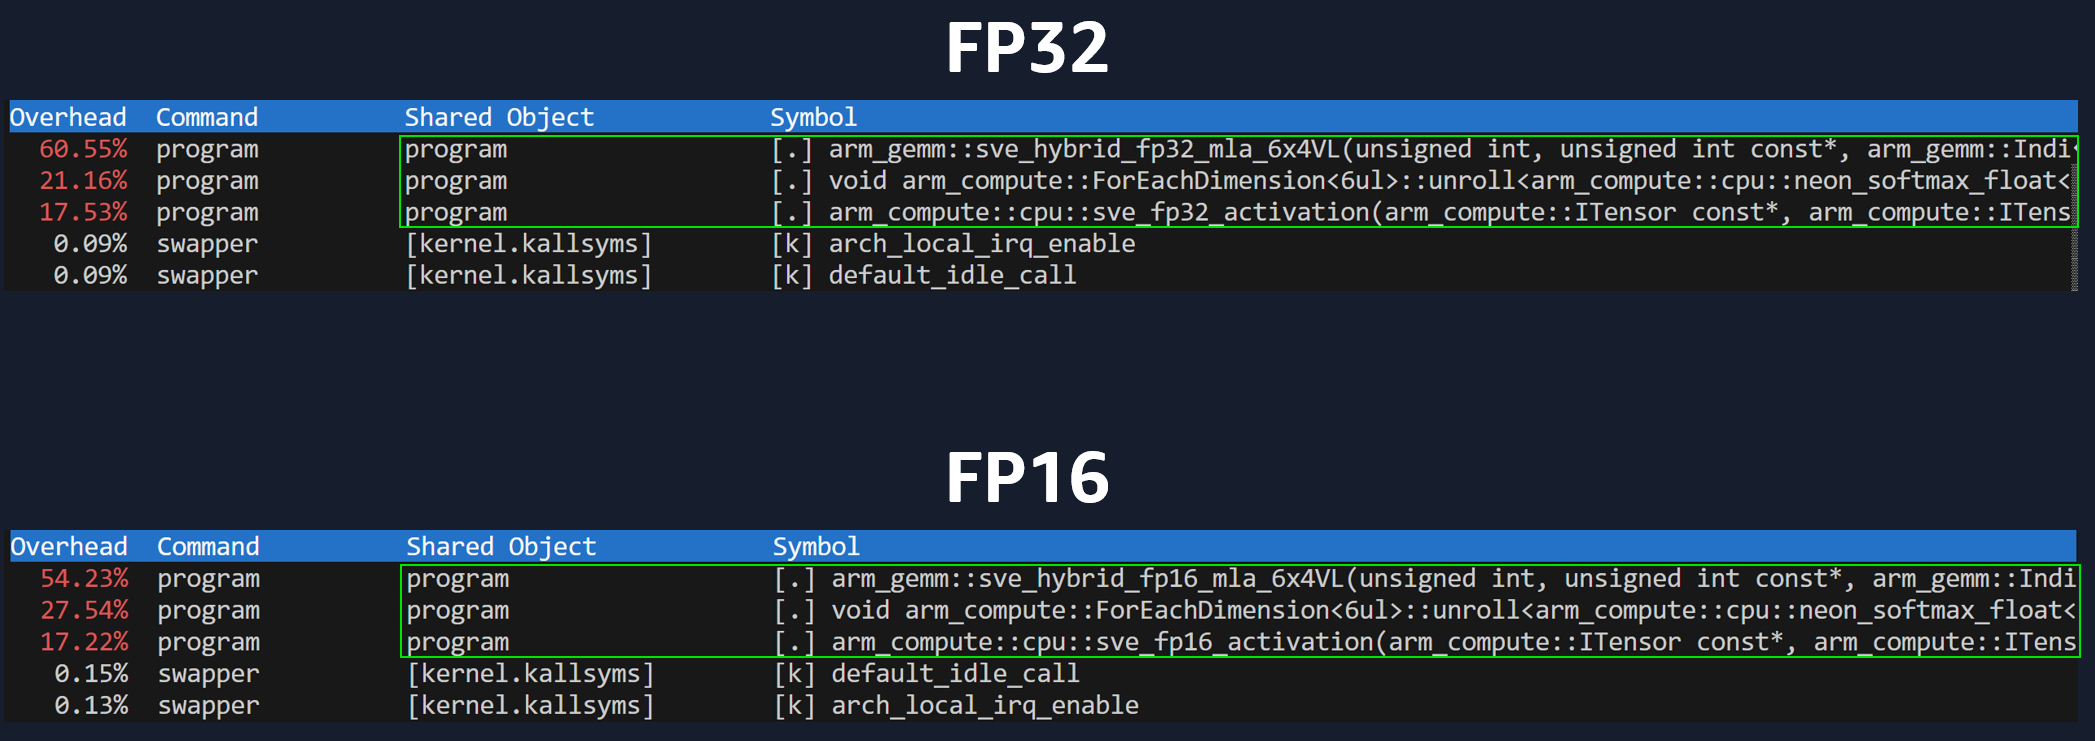
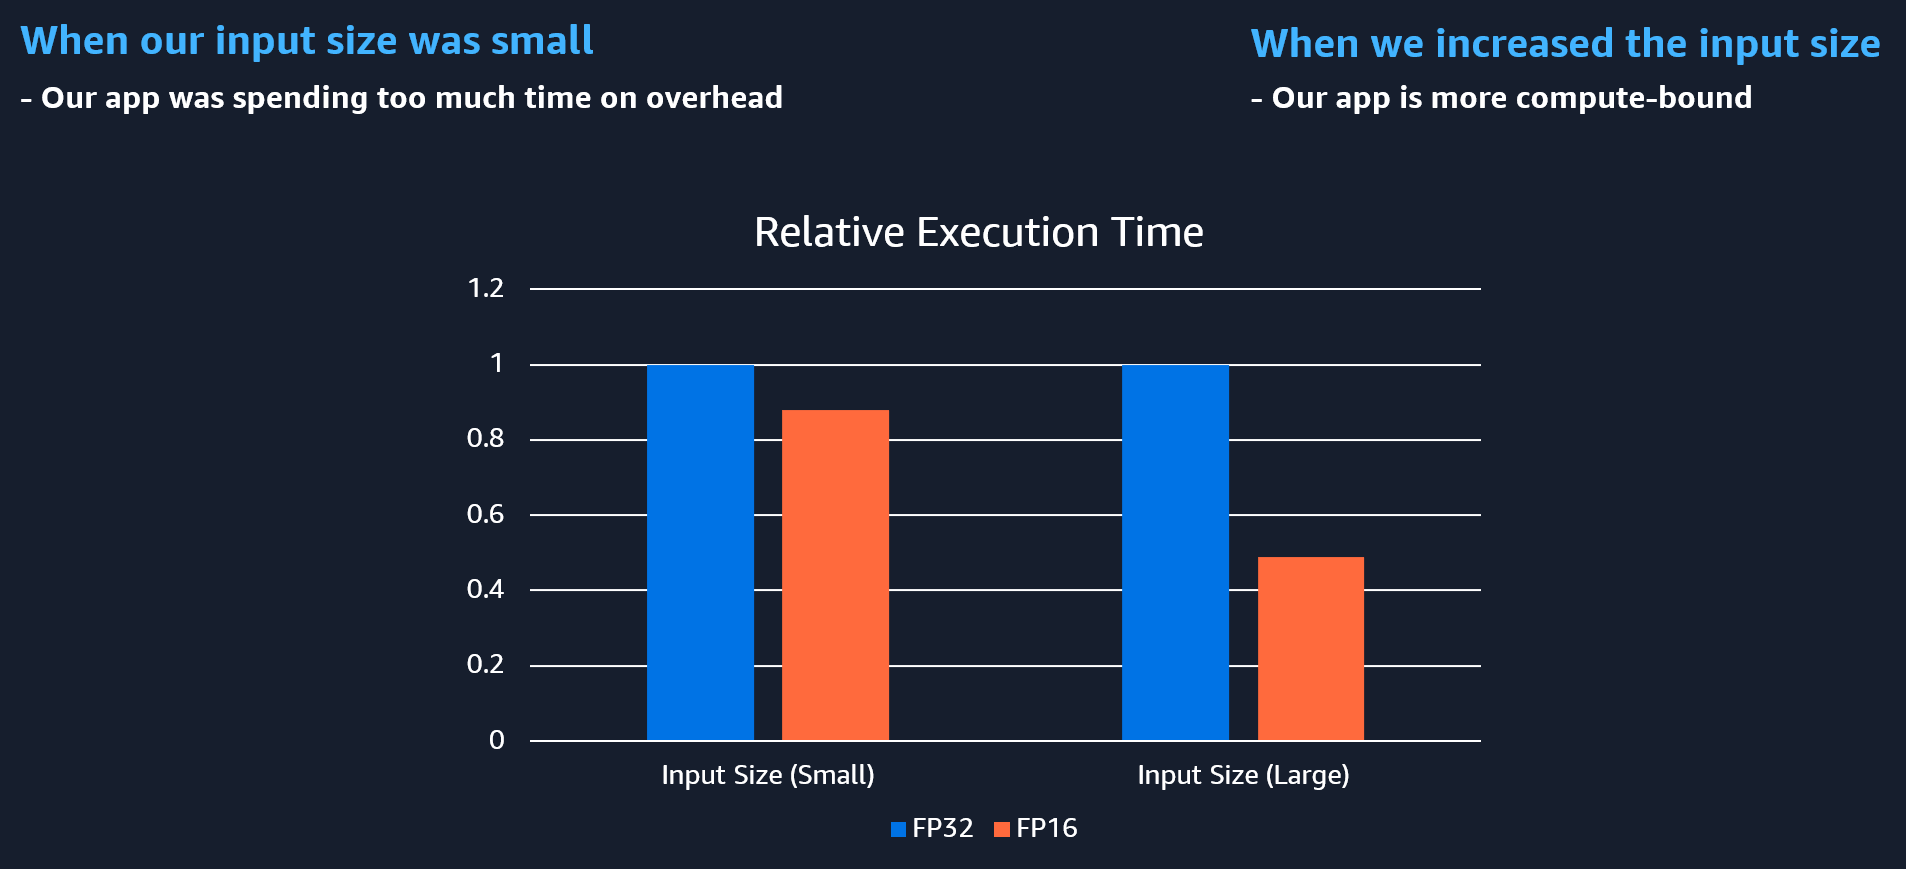
If you don’t realise your software is spending most time on overhead, then you won’t understand why changing our matrix data type from FP32 to FP16 doesn’t make our app faster (as you’d expect). Notice what happens when you change data types, but your program is limited by overhead (left side). There’s barely any difference in execution time. As our app becomes more compute bound (or memory bound), doing changes like reducing data precision will yield an effect on performance.
Going from Compute to Memory-bound
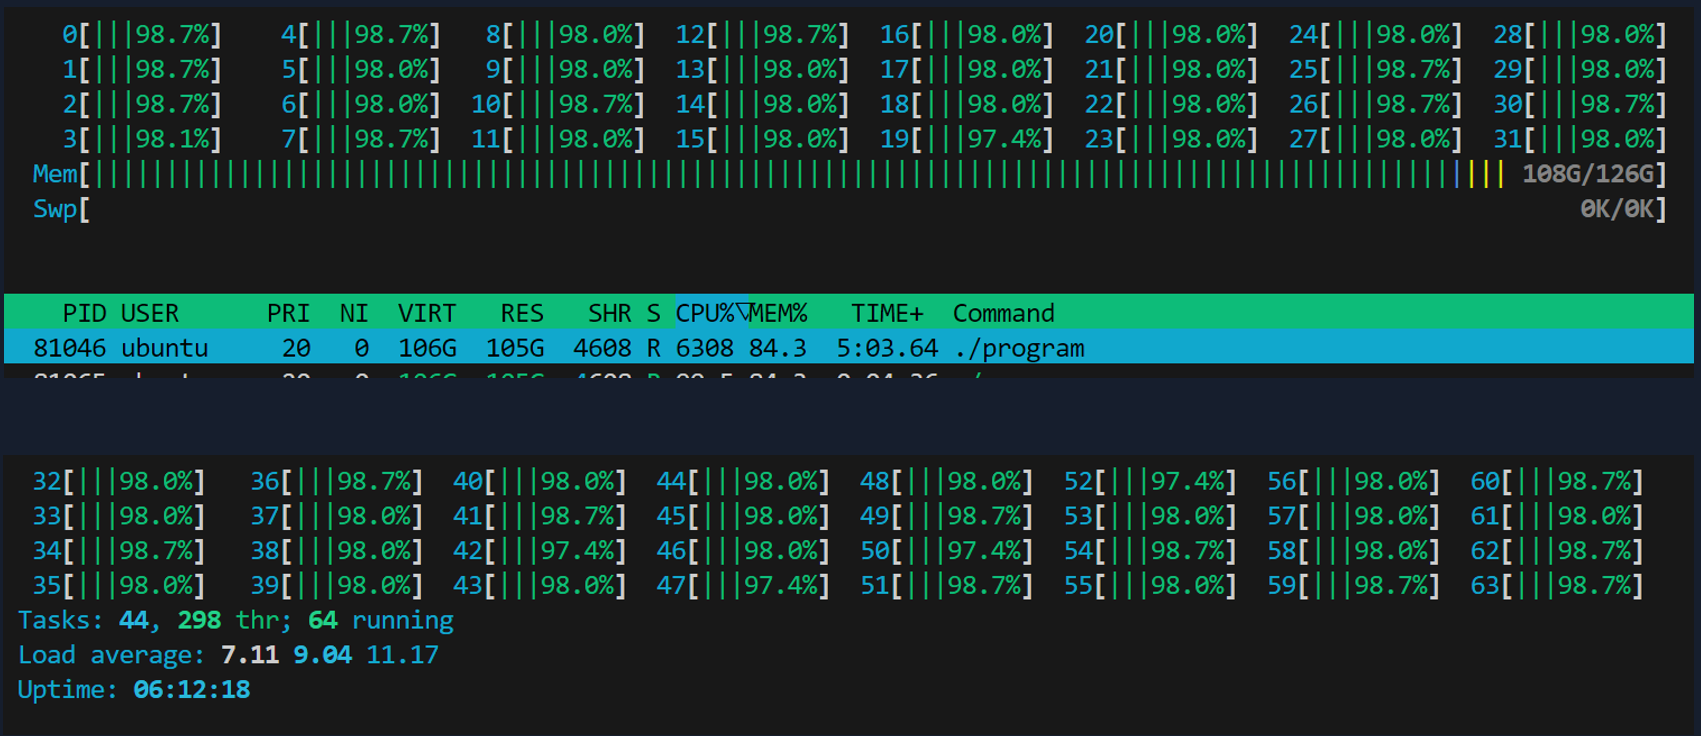
We first managed to get our program to use more compute units and spend less time on ML framework overhead, but that still leaves a lot of memory unused (doesn’t mean you have to use it, but I want to show you an example that is memory bandwidth-bound).
In reality, most LLMs are limited by memory bandwidth as they do frequent memory accesses (the Transformer block decoders have a mathematical constraint to run sequentially, going back and forth to memory). So, let’s first scale up to use most resources we have on this instance.
Memory capacity is unrelated to memory bandwidth, but I’ve further increased the data sizes in order to add memory copies to showcase what happens if you do inefficient things with your code. We now have lots of unnecessary copies of 1.5GB matrices.
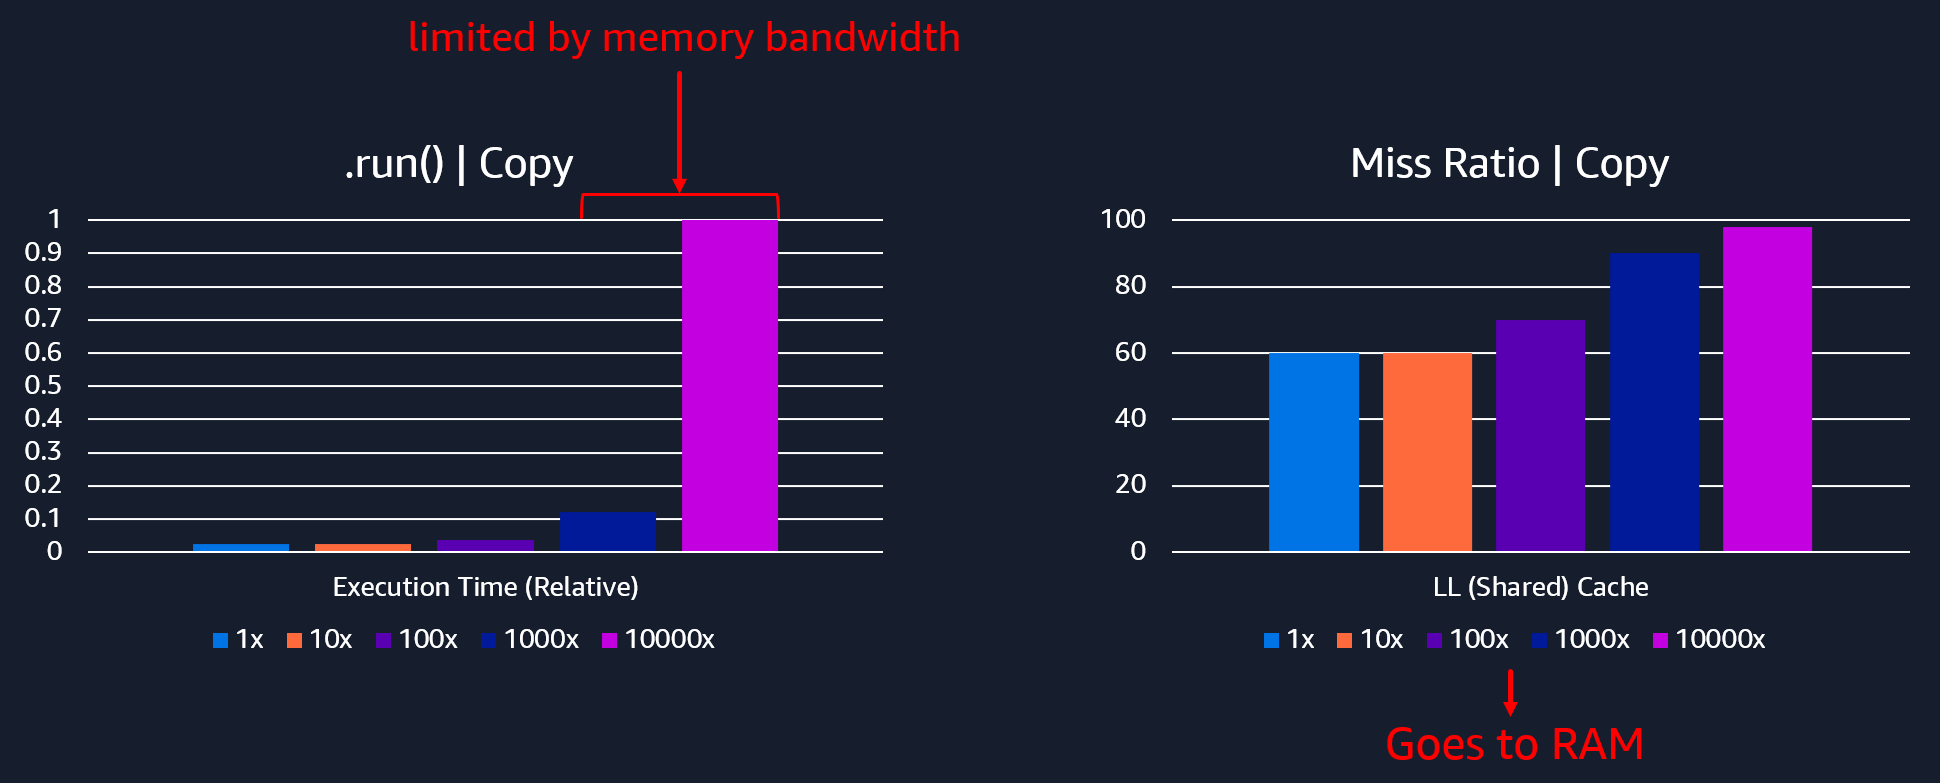
When your software is not reaching the memory bandwidth available (e.g. ~300GB/s for this instance), you shouldn’t see much of an impact on execution time. You are likely relying on CPU caches and even if you reach the RAM, you still move faster than if you were delayed by bottlenecks on memory bandwidth (which will dramatically increase the latency for data transfers).
In the image below, we went from 30secs when doing 1 extra copy per self-attention layer to over 22 minutes when doing 10000 copies. Also, our load-store instructions spiked up (to over 40% of total instruction mix instead of 20%).
Obviously, production software won’t be doing copies like these in this way, but it is still likely there will be inefficient use of memory. Or that simply the scale of the ML model architecture (like with LLMs) forces the program to become memory bandwidth-bound.
Conclusion
Code changes (even small ones) or changes to the software stack (e.g. PyTorch version, Linux kernel version), can shift the execution of your software to leverage other parts of the hardware more, like it was demonstrated in this blog post.
Imagine your typical developer on StackOverflow, making changes when they see advice like:
- Install PyTorch 2.2.0, not 2.2.1
- Disable gradients on those layers
- Use XLA, maybe it helps
- You need more threads
- Upgrade Ubuntu to 22
- Use EC2 .16xlarge machines
- Change your data format and so on…
Nothing inherently wrong with these changes. But the effect on performance is often overseen because:
- Many apps don’t have performance regression test suites
- Engineers don’t have time to understand what changed in hardware utilization
We’d need a synthetic benchmark to be deterministic (e.g. careful with EC2 shared resources) and to match the characteristics of an entire software stack that your app leverages. And then maybe the benchmark results might get closer to real results, but if your aim is to save money, then you’re better off optimizing what you have.